

The International Astronomical Youth Camp (IAYC) is a unique 3-week experience for young people aged 16-24 with an interest in astronomy. The IAYC started in West Germany in 1969, and has continued ever since, being held in a number of locations throughout Europe and northern Africa. The camp has always been very international, but the number of countries represented at the camp has grown through the decades.
I’ve been a part of the IAYC community since 2014, becoming a leader in 2018 and later serving on the board of IWA e.V., the non-profit organisation that oversees the IAYC. As a bit of a data nerd, I found myself curious about the camp’s history through the anonymised statistics we have in our records. I was also curious to try to recreate the “bar chart race” plots I’d seen in a few YouTube videos, and so, I decided to make this visualisation of the nationalities of participants at the IAYC through time.
If the embed doesn’t load on your device, you can view the visualisation in browser here: https://public.flourish.studio/visualisation/13323066/.
Some interesting discoveries
If you go to the plot on the Flourish site, you’ll find that you can play, pause and select specific years. You can also toggle specific continents, to view e.g. only the European countries. This brings to light some pretty interesting observations!
NUMBER OF UNIQUE COUNTRIES
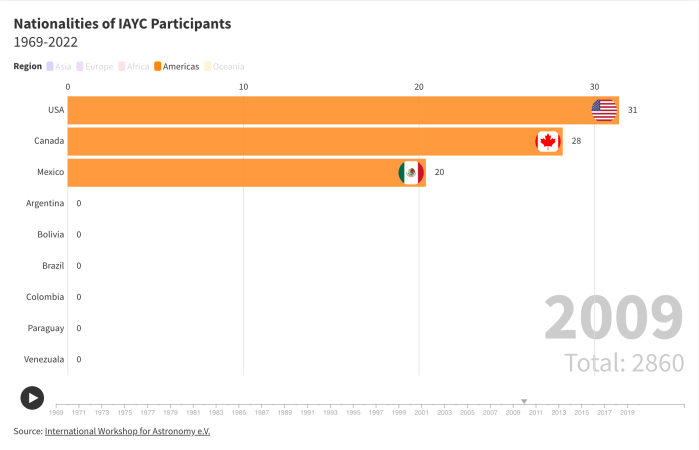
The number of unique countries exploded after 2009-2010, particularly with South America (Brazil, Colombia, Argentina, Bolivia, Paraguay, Venezuela) and Asia (Bhutan, Cambodia, Malaysia, Nepal, Indonesia, Iraq).

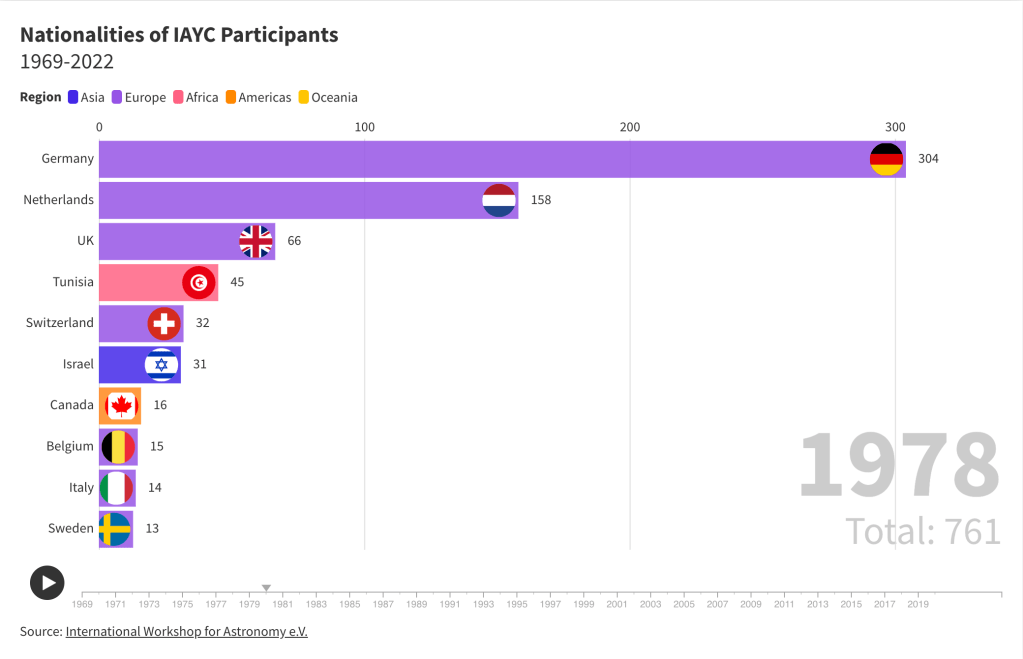
GERMANY AND NETHERLANDS
As a camp starting in Germany, I’m not surprised to find that the most common nationality through its history has been German, and I knew from word of mouth that the second would most likely be Dutch. It’s interesting to compare these statistics to more recent IAYCs, where these two nationalities have not been very common. Instead Spain, UK, Italy and USA have been more dominant, but also a larger total number of different nationalities are represented each year compared to the first years of the IAYC.

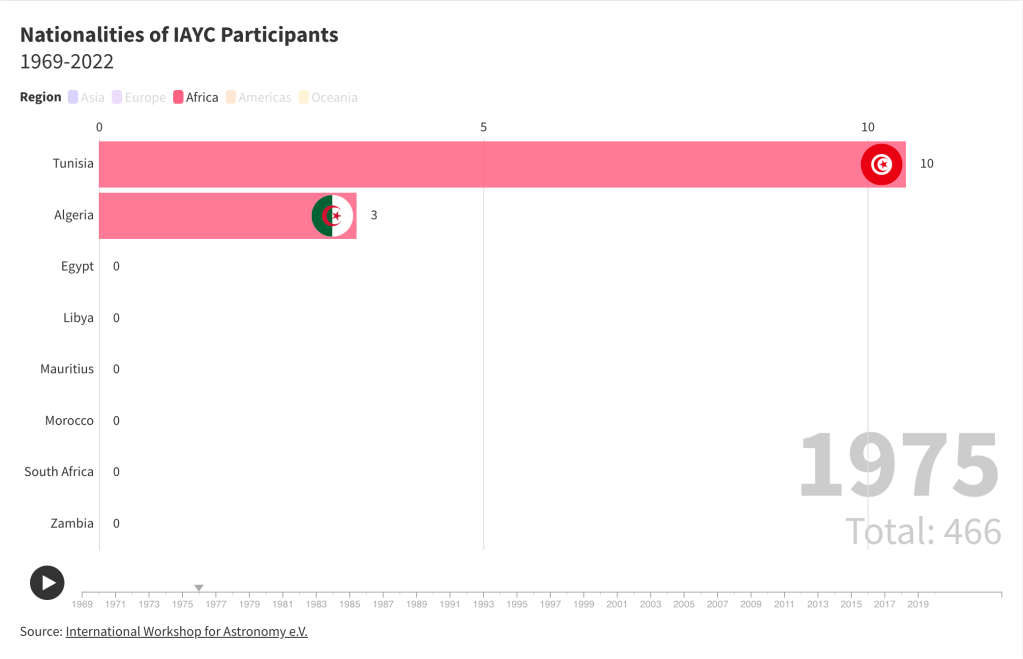
NORTHERN AFRICA
Another interesting observation is how northern African participants were much more common in the 1980s, but have almost disappeared altogether since. Perhaps this is connected to the four camps held in the region: 1975 and 1978 in Tunisia, then 1981 and 1984 in Egypt.
All IAYC leaders were previously IAYC participants, and typically the leader organising the camp will need to speak the language of the chosen host country. There is therefore a cyclic effect: hold a camp in a country – more participants from that country will attend – increase likelihood of recruiting leaders from that country – possibility to hold a camp in that country. This can be observed in recent years too: we have held the camp in Germany in 2019, 2022, and 2023, and after not having many German participants for some time, we are now looking at a large number once again. Of course, there are other factors in increasing applications from a given nation or demographic, such as targeted advertising and special grant programs, but things these are easier to explore and implement with existing networks in a particular country.

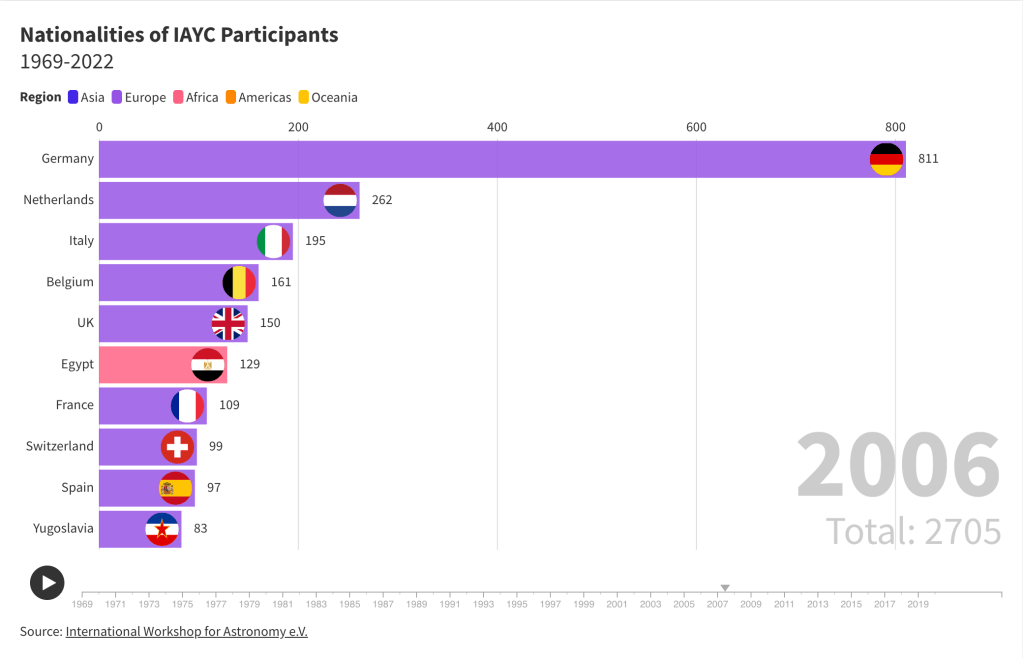
SPAIN
Within the IAYC community there is what we lovingly call the “Spanish Invasion of 2009”. It turns out that this happened over a much longer time than just one camp. From 2006 to 2014, the total number of Spanish participants doubled, and Spain shot from 9th to 4th most represented country in IAYC history. The growth has slowed a little since, but as of 2022 Spain has solidified itself as the 3rd most represented country with 263 participants, and if current trends continue, may soon overtake the Netherlands.

How to make a Bar Chart Race plot
Simply create an account on Flourish, select “new visualisation” and then “bar chart race”. This pre-generates a spreadsheet with the country names and links to the flag images. All you need to do is replace the default data with your data – make a spreadsheet with the same layout as the default data sheet on Flourish and either copy-paste into the Flourish site, or import the spreadsheet. And of course, you’re not limited to countries through time, you can make anything!


Leave a comment